
Author: Nina Wycech // Editors: Neve Diggle and Emily Barrett
Even if you are not studying science, you have likely heard about genetic predispositions. We intuitively assume that we’re more likely to experience a disease that our ancestors had. Although not always true, many conditions run through generations, such as autism spectrum disorder (ASD), attention deficit hyperactivity disorder (ADHD), or hypertension. The most commonly cited example of genetic predisposition is the BRCA1 mutation, which highly increases one’s chances of developing breast cancer. However, things are more complicated with so-called complex diseases, which do not follow simple genetic rules. Many variations within our genetic profile and even environmental factors all contribute to their development. Since they are polygenic, scientists base the calculation of their likelihood not on one gene mutation, but on the entirety of their genetic information – their genome. The outcome, called the polygenic risk score (PRS), tells scientists and clinicians whether someone is more or less likely to develop a condition.
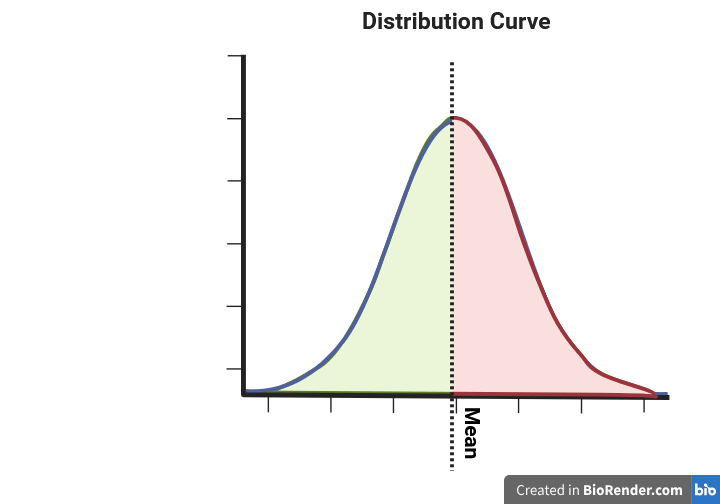
The polygenic risk score is always standardised to the population for which it has been calculated. What does it mean? Firstly, as shown below, it follows a normal distribution with a mean of zero. That way, a positive score, regardless of the number, will translate to an increased risk in comparison to the average of the population one is part of, e.g., British of Black ancestry.
How is PRS calculated?
Firstly, a population with the specific condition is sampled, and their genomes are investigated. Such a study, called Genome-Wide Association Study (GWAS), detects genetic markers and, thus, genes in their vicinity. By comparing the test sample to the control subpopulation (without the disease), it finds variants associated with the investigated condition. Not all variants will have the same propensity to cause the disease. Therefore, the PRS is calculated as the weighted sum of disease-associated variants for an individual, or statistically speaking, a weighted sum of the effect size estimates.
It should be noted that the GWAS results are not final – the more studies there are, the bigger our samples, and therefore the more accurate our prediction of the disease-associated genes. For example, the first GWAS of schizophrenia on a sample of 320 patients was published in 2006. Since the largest study of almost 37,000 patients pinpointed a further 108 genomic locations of interest (Psychiatric Genomic Consortium, 2014), and the trans-ancestry study analysed GWAS results to date for the European and East Asian ancestries.
Does PRS equal a diagnosis?
Statistically speaking, PRS shows correlation, not causation. Plainly speaking, we estimate that the disease and the specific set of genes often exist together, but we can’t diagnose a disease based on the same set of genes. The causation, whether a set of genes and which ones specifically cause a disease, should be further established, for example, with a Mendelian Randomisation (MR) study.
Bioinformatic tools for PRS calculations
Based on my research, the most popular tool is PLINK, which performs the basic PRS calculation from a command line. More advanced tools like LDpred, PRS-CS, and PRSice offer more precise calculations. You may ask, as I did, if it’s just a simple weighted sum, what benefit do they offer?
- Comparing genomes with different statistical significance thresholds. The more comparisons, the more noise we get in our analysis. Since here we compute an enormous number of comparisons, we might want to test how stringent we want our sieve to be.
- Detection of the genes important for the disease is based on the presence of genetic markers, whose presence can often be linked with each other (called linkage disequilibrium). Advanced software can account for that.
- Prevention of overfitting (achieving wrong results by following the trend too closely) with Bayesian shrinkage – a statistical method in which the extreme results are brought closer to the mean.
How can PRS be used?
From a scientific perspective, PRS is a method of quantifying the disease risk based on the most recent GWAS, which can be further correlated with other phenotypes. It allows researchers to test hypotheses, such as: “Does the risk of having ADHD correlate with insomnia?”. Furthermore, PRS could aid early diagnostics and prevention of diseases, such as implementing lifestyle changes when at higher risk of coronary disease. It can also be used for genetic pre-screening, as suggested for osteoporosis by Dr Forgetta and her coworkers from McGill University. Interestingly, they propose using PRS of bone marrow density to exclude individuals unlikely to be at risk of low density from the osteoporosis screening program.
On the other hand, PRS are not free of limitations. As a statistical measure, they are subject to imprecision. We should also keep in mind that the development of complex diseases is also influenced by one’s environment. Most importantly, most of the studies are performed on people of White European ancestry, and the research on people of diverse backgrounds is still lacking. Similarly, the GWAS results themselves, on which we base the calculation, can be biased. For instance, the presence of diagnosis barriers for diagnosis of the neurodevelopmental conditions in POC (People of Colour) and women makes the studies to date somewhat limited.
Bio: Nina Wycech
Pronouns: she/her
I consider myself a collector of fun facts and interesting stories – which often come from science. I’m somewhat of a scientist myself. I graduated B.Sc. Neuroscience from UoM and I’m currently continuing my education at Glasgow doing an M.Sc. in Bioinformatics. My favourite subject is sleep & circadian rhythms, but I’ve been exploring genome sequencing extensively throughout my study.

Discover more from Research Hive
Subscribe to get the latest posts sent to your email.
